 Sunita Somvanshi
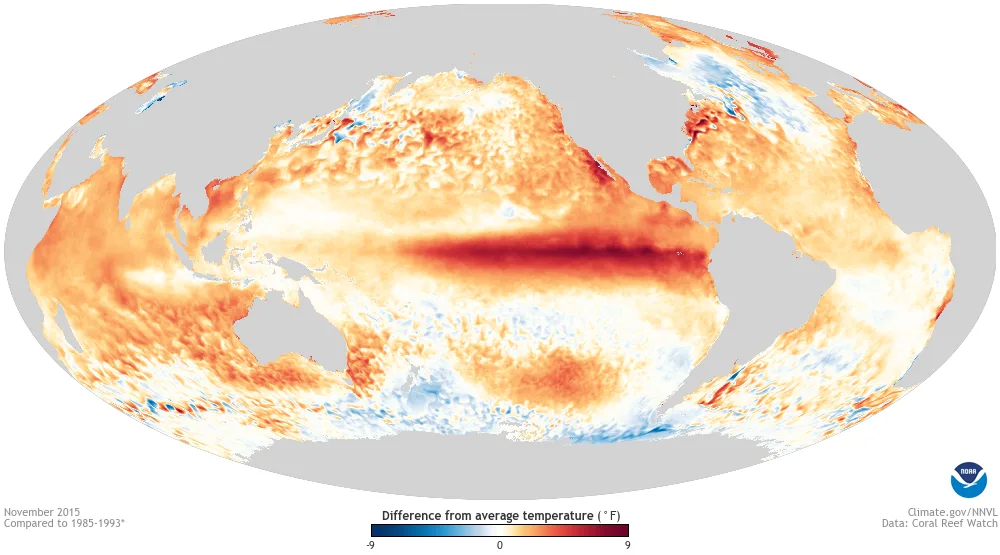
A “Super El Niño” is reshaping this winter’s weather across the US and Canada, and the temperature and precipitation maps NOAA released for 2026–27 look nothing like a typical winter forecast. The ocean heat driving it is at its highest reading in years—but what NOAA actually predicts and what viral “state snowfall total maps” claim it predicts are two very different things.
The conventional Niño 3.4 sea-surface temperature anomaly reached +3.3°C for the week centered on October 14, 2026—the most recent confirmed value from the International Research Institute for Climate and Society—a textbook Super El Niño signature confirming sustained, deep warming in the equatorial Pacific. NOAA’s 2026–27 US Winter Outlook uses that oceanic baseline to forecast temperature and precipitation probabilities by region:
| Region | Temperature Outlook | Precipitation Outlook | Drought Impact |
|---|---|---|---|
| Pacific Northwest / Northern Rockies | Above normal (warmer) | Below normal (drier) | Worsening drought |
| Northern Midwest / Great Lakes | Above normal | Below normal | Drier conditions |
| US Southwest / Southern Plains | Near to above normal | Above normal (wetter) | Drought relief likely |
| Southeast / East Coast | Near to above normal | Above normal (wetter) | Drought relief |
| Alaska | Above normal | Below normal | Drier than average |
| Sierra Nevada / Southern Rockies | Varies by elevation | Above normal | Improved snowpack |
For residents in the US Southwest, Southern Plains, and East Coast, a supercharged El Niño tips the odds toward wetter-than-normal winter storms that will help end regional droughts and boost Sierra Nevada and southern Rockies snowpack. The Pacific Northwest, northern Rockies, and Great Lakes face warmer, drier conditions with worsening drought.
What NOAA Actually Publishes—and What It Doesn’t
There is one correction worth making before anyone books a ski trip based on a social media forecast: NOAA does not publish a national seasonal snowfall total map. The agency’s winter outlook covers only temperature and total precipitation probabilities. The viral maps circulating online showing specific inch-count snow forecasts by state are mixing historical first-snowfall climatology data, Farmers’ Almanac projections, or statistical models with NOAA’s probabilistic outlook—and presenting them as official government predictions. They are not.
What NOAA does show is that the southern Rockies (Colorado, Utah, New Mexico), the Sierra Nevada, and portions of the Mid-Atlantic coast face above-normal precipitation odds through winter. Given normal temperature profiles at elevation, above-normal precipitation in those areas translates to above-normal snowpack probability—which is why southern Rockies ski resorts are trending toward a better-than-average season while northern Rockies resorts face the opposite.
The elevated Niño 3.4 anomaly is also shifting drought patterns dramatically. El Niño’s southward-displaced subtropical jet stream is expected to deliver sustained moisture into the US Southwest, Southern Plains, and Southeast—regions that experienced significant drought severity in 2025 and early 2026. The northern tier, including northeastern Oregon, eastern Washington, and parts of the northern Rockies, faces continued drought worsening through spring. For the stratospheric layer that interacts with this pattern at the seasonal level, see early polar vortex weakening forecast for November. For regional drought and home heating cost planning, see US drought monitor and winter energy costs.
Does NOAA release an official winter snowfall map?
No. NOAA’s seasonal winter outlook only forecasts the probability of above-, near-, or below-average temperatures and total precipitation—not specific snowfall totals. However, by combining NOAA’s wetter southern jet stream outlook with elevation and temperature data, forecasters project above-normal snow potential for the Sierra Nevada and southern Rockies.
What does a strong El Niño mean for US winter weather in 2026–2027?
A strong El Niño shifts the subtropical jet stream southward, bringing warmer and drier conditions to the Pacific Northwest and northern Rockies while increasing precipitation across the Southwest, South, and East Coast. NOAA’s 2026–27 winter outlook reflects that pattern directly, with the South and East Coast favored for wetter-than-normal conditions and the northern tier for drought.
Which states will get the most precipitation this winter according to NOAA?
NOAA shows above-normal precipitation probability for the US Southwest (Arizona, New Mexico, Southern California), Southern Plains (Texas, Oklahoma), Southeast (Georgia, the Carolinas, Florida), and much of the East Coast. These probabilities reflect total liquid precipitation, not guaranteed snowfall, and apply to winter as a season rather than any specific storm event.
Evergreen search note: these regional outlooks remain accurate through the winter season. Return to this analysis as December and January storm patterns develop to compare how the NOAA probability maps are tracking against actual weather events.