 Rahul Somvanshi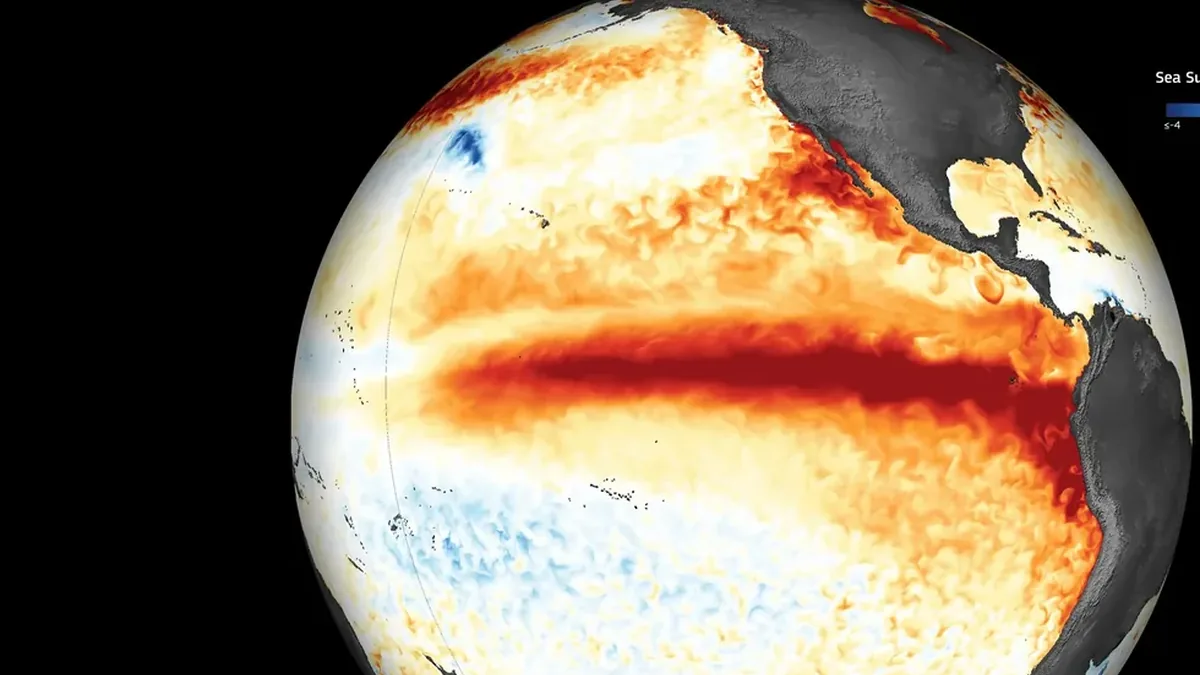
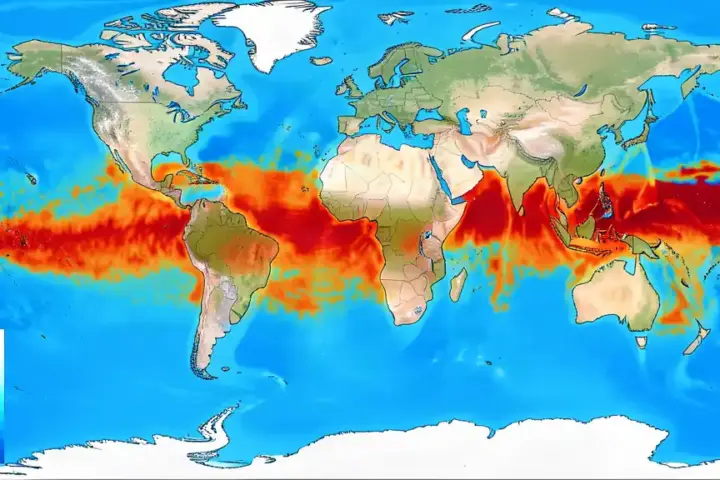
Pacific sea surface temperatures have now crossed into territory that may make this the strongest El Niño on record. For Australians watching the headlines, the word “super” sounds like a clear warning. The Bureau of Meteorology is being careful to explain what that label actually means — and what it does not.
The Bureau of Meteorology’s Niño3.4 index reached +2.51°C for the week ending September 13. That is the standard measure of central Pacific warming, and the threshold for a standard El Niño is +0.80°C. The 1982–83 event — previously the strongest on modern record — peaked at around +2.6°C. BoM’s models are forecasting this event will peak above +3°C.
If that forecast holds, this could become the strongest El Niño since reliable records began in 1950.
BoM has confirmed the event is likely to become the strongest El Niño on record; the agency uses “strong El Niño” in its own classification and does not apply “super El Niño” as a formal label. The World Meteorological Organisation has forecast the event is near-certain to continue through at least February 2027, as Karmactive reported in September when the WMO confirmed near-certain continuation of the event alongside global drought and flood risks.
Australians should not read the “super El Niño” label as a nationwide forecast of drought or extreme heat. BoM’s current seasonal outlook shows above-average temperatures across most of Australia, but a mixed rainfall picture. Some southeastern areas — parts of southern New South Wales, Victoria and Tasmania — are likely to see below-average rainfall from October to December. Parts of Western Australia and central and northern Australia are forecast to receive above-average rainfall over the same period. Local and regional forecasts remain more useful for decisions about heat, water and fire risk than the El Niño strength rating alone.
Why a stronger El Niño does not mean a worse Australian summer
BoM explicitly states that the strength of the Pacific signal does not directly determine how severe the Australian effects will be. Australia’s climate responds to multiple drivers at once. The Indian Ocean Dipole, surrounding sea surface temperature patterns, and broader atmospheric circulation all shape what actually reaches Australian shores.
This distinction matters for planning. The Niño3.4 index measures ocean heat in the central Pacific. It does not measure Australian heat or rainfall. A very strong Pacific event can produce moderate impacts in Australia if other climate drivers partly offset it — and previous events have demonstrated this. The 1997–98 El Niño was one of the strongest on record globally, yet it had far weaker impacts in Australia than its Pacific strength suggested — affecting parts of south-eastern states, but not producing the widespread severe drought its global intensity might imply.
Australia has already recorded its warmest winter on record, as Karmactive’s spring heat report noted. BoM’s spring outlook signals continued above-average temperatures into the warm months ahead. The fire and drought risk question, though, requires location-specific seasonal forecasts — not the headline Niño3.4 figure.
The October–December rainfall breakdown currently shows the geographic complexity clearly: below-average rainfall in parts of the southeast, while much of the country’s north and west is forecast near-average or wetter. A resident in Melbourne, Sydney or Hobart is looking at a different picture from someone in Perth or Darwin.
Karmactive’s earlier reporting on the strengthening event — when the index first crossed +2.45°C and the WMO confirmed it was tracking toward the strongest event since 1950 — already made the case that event strength and Australian impact are not the same thing. BoM’s current statement reinforces that point more directly.
Does a stronger El Niño mean worse weather in Australia?
No. BoM says the strength of an El Niño does not directly determine how severe its Australian effects will be. Rainfall and temperature also depend on the Indian Ocean Dipole, surrounding sea temperatures, atmospheric patterns and seasonal conditions. Current forecasts show different rainfall outcomes across Australia despite the unusually strong Pacific warming.
BoM updates its seasonal outlook each month. The next update will give a clearer picture of the December–February period — the peak of both summer heat and fire season risk across southern Australia. BoM’s location-specific seasonal forecasts are the right reference for property, water and fire planning.