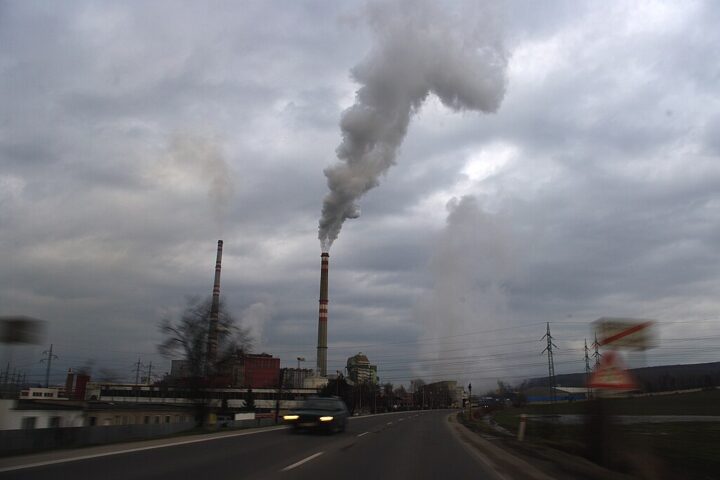
A new study has revealed the areas in the U.S. with the worst air quality in the country. According to new research, the Inland Empire has the worst air quality in the United States. Greater Houston ranks second in the ranking.
Data experts at SmartSurvey examined 2023 data from the United States Environmental Protection Agency, using 12 factors that measure air quality to create total index scores for each area. These scores were then ranked from lowest to highest to reveal the areas with the worst air quality: the lower the index score, the worse the air quality.
The Riverside-San Bernardino-Ontario metropolitan area in California, also known as the ‘Inland Empire,’ tops the ranking with an overall index score of only 17.03, making it the area with the worst air quality. The Inland Empire experienced only 54 days of good air, where the air quality is satisfactory and air pollution poses no risk, as well as a staggering 59 unhealthy days for sensitive groups.
Greater Houston, or the Houston-The Woodlands-Sugar Land metropolitan area in Texas, ranks second with an index score of only 28.36. Surprisingly, Greater Houston saw only 38 good days and 21 days that were unhealthy for sensitive groups.
The Albuquerque metropolitan area in New Mexico ranks third in the ranking: the area has an air quality index of 29.64. In Albuquerque, there were 130 moderate days, where the air quality is acceptable but poses a risk to people with severe sensitivities, as well as only 43 good days.
In fourth place is Greater Chicago, also known as the Chicago or Chicago-Naperville-Elgin metropolitan area, with a total air quality index score of 32.58. Greater Chicago experienced 29 unhealthy days for sensitive groups and eight generally unhealthy days, the latter referring to air quality that may cause some of the public to experience health effects.
Similar Post
Next in the ranking is Greater Milwaukee (Milwaukee-Waukesha-West Allis in Wisconsin), where the air quality index is only 33.41, placing the area in fifth place. Greater Milwaukee experienced only 95 good days and 66 moderate days.
Sixth in the ranking is El Centro, the second Californian area in the ranking, with an index score of 33.94. El Centro had 66 moderate days, 18 unhealthy days for sensitive groups, and three hazardous days, the latter being health warnings of emergency conditions likely to affect everyone.
Greater Cleveland, or the Cleveland-Elyria metropolitan area in Ohio, also appears in the ranking, with an index score of 35.37, placing it in seventh place overall. Greater Cleveland experienced a staggering 122 moderate days and four unhealthy days.
Detroit-Warren-Dearborn in Michigan, also known as Metro Detroit, scored 37.39, placing it in eighth position. The area recorded only 54 good days, 104 moderate days, and seven unhealthy days.
The Denver metropolitan area (Denver-Aurora-Lakewood, Colorado) scores 37.7, placing it ninth in the ranking. The Denver metropolitan area had only 65 good days, 175 of which were moderately bad, and 24 unhealthy for sensitive groups.
In tenth place is the Indianapolis metropolitan area in Indiana (Indianapolis-Carmel-Anderson), with a total air quality index score of 38.57. This area experienced 142 moderate days, 16 unhealthy days for sensitive groups, and two unhealthy days.
| Position | Area | Air Quality Index Score |
| 1 | Riverside-San Bernardino-Ontario, CA | 17.03 |
| 2 | Houston-The Woodlands-Sugar Land, TX | 28.36 |
| 3 | Albuquerque, NM | 29.64 |
| 4 | Chicago-Naperville-Elgin, IL-IN-WI | 32.58 |
| 5 | Milwaukee-Waukesha-West Allis, WI | 33.41 |
| 6 | El Centro, CA | 33.94 |
| 7 | Cleveland-Elyria, OH | 35.37 |
| 8 | Detroit-Warren-Dearborn, MI | 37.39 |
| 9 | Denver-Aurora-Lakewood, CO | 37.70 |
| 10 | Indianapolis-Carmel-Anderson, IN | 38.57 |
“More people than ever are paying attention to the effects of emissions and fossil fuels on our environment, making studies like this so important. Identifying the areas in the US with the worst air quality, based on empirical evidence and data, brings awareness to how the air we breathe can be unhealthy, or even hazardous.
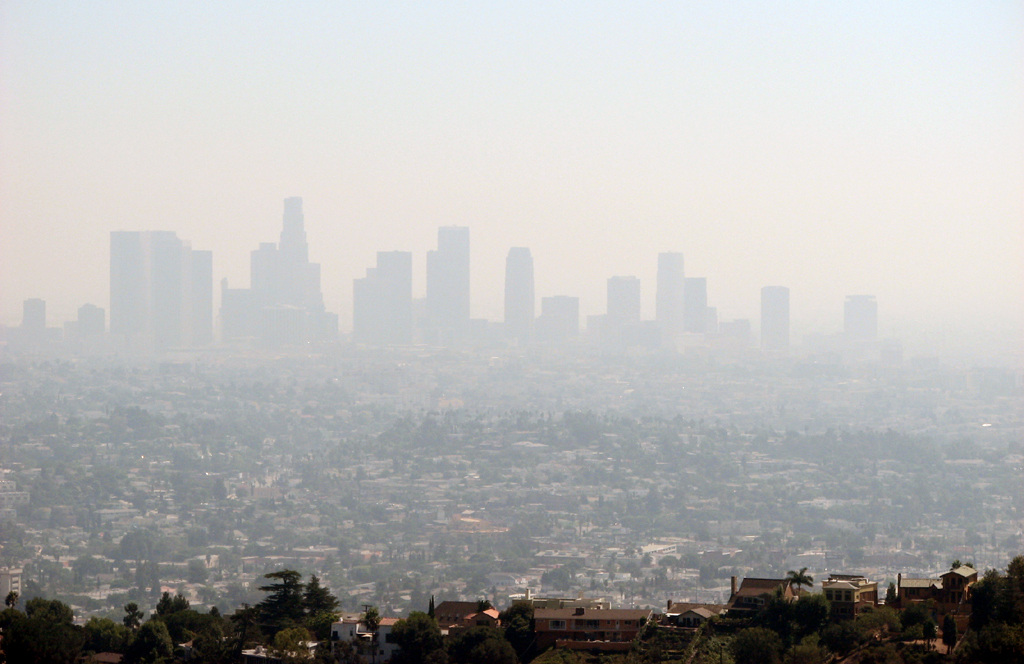
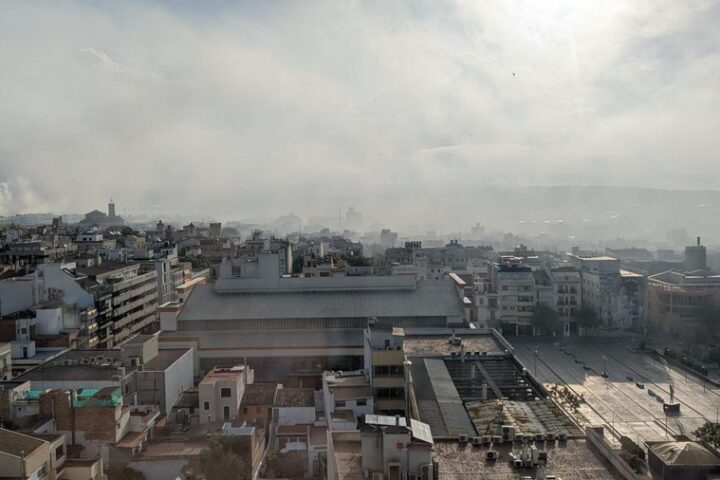
The areas identified experience a shocking level of poor air quality, with the Inland Empire area unfortunately seeing an extremely low index score, more than 10 points below Greater Houston in second place. It is surprising to see Inland Empire with worse air quality than its populous neighbor, Greater Los Angeles. It is speculated that natural wind patterns on the coast transport harmful aerosols from LA toward Inland Empire, where the pollutants are then trapped by mountainous terrain.”
Mo Naser, CEO of SmartSurvey and data collection expert,







![Big city Los Angeles smog building [photo source: pixabay] [PDM 1.0]](https://www.karmactive.com/wp-content/uploads/2025/04/46-of-Americans—156-M—Now-Breathe-Hazardous-Smog-and-Soot-State-of-the-Air-Report-Exposes-Decade-High-Pollution-1.jpg)


