 Karmactive Staff
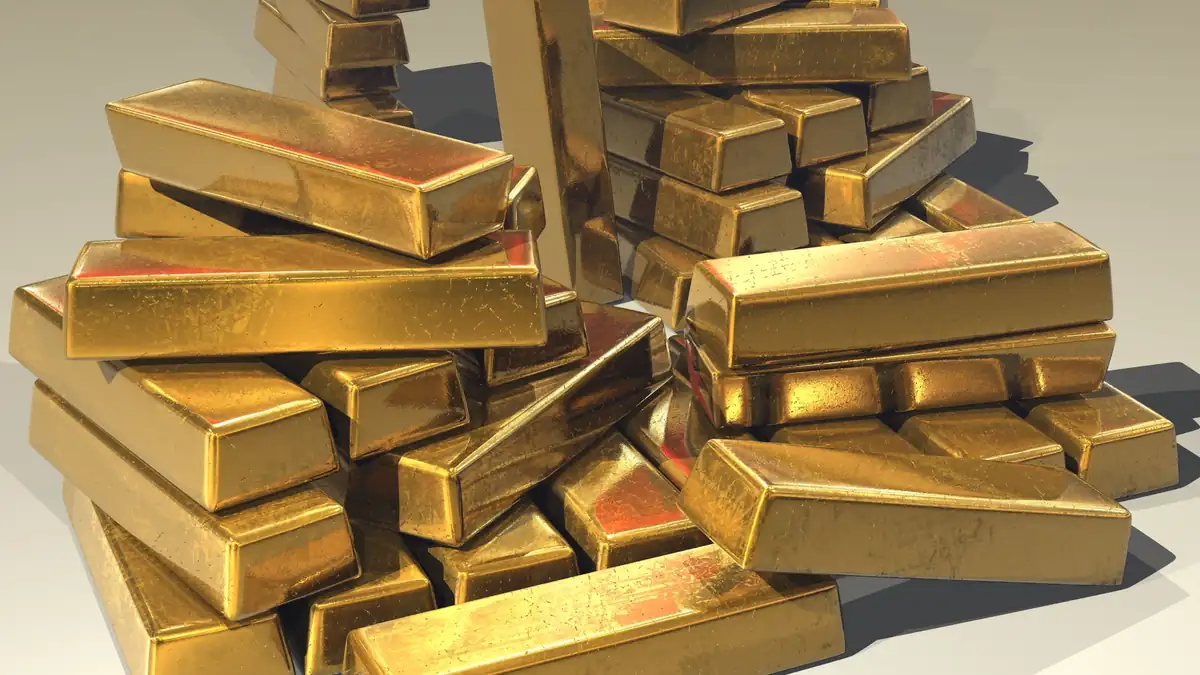
If you track gold prices, the pattern for the week ending October 24, 2026 repeated itself: oil rose on geopolitical tensions, inflation concerns followed, expectations of Federal Reserve rate cuts were pushed further out, and gold came under selling pressure. Here is what the current week’s numbers show and how the mechanism works.
Spot gold was trading at approximately $3,994.90 per ounce on the morning of October 24, 2026, with a daily low of $3,975.10 and an intraday level around $4,016.27 earlier in the session on October 23, according to Kitco and Reuters-sourced reports. Gold is on course for a weekly loss of approximately 3.5% to 4%, its steepest weekly decline since June 2026 and the second consecutive weekly loss. The driver is oil prices: crude rose on Middle East tensions, including concern over Hormuz Strait disruptions, which pushed back market expectations for Federal Reserve rate cuts. The next Federal Reserve meeting is scheduled for October 27–28, 2026.
For anyone holding gold as part of a broader savings or investment strategy, the relevant context is not any single week’s number but the direction of Fed policy, the dollar and real yields. When rate-cut expectations are pushed back—particularly because of oil-driven inflation—the opportunity cost of holding non-yielding gold increases relative to yield-bearing assets. That dynamic is the mechanism behind this week’s decline, a pattern that follows the same path as an earlier stretch covered in gold’s decline amid oil surge and rate-hike bets.
Why Higher Oil Pressures Gold and When It Does Not
The mechanism runs through inflation and the dollar. Higher oil feeds into headline inflation, a trend the U.S. Bureau of Labor Statistics’ August 2026 CPI release showed running at 3.4% over the prior 12 months, with energy inflation at 16.3% over that period. That reduces the case for the Federal Reserve to cut rates, or raises the possibility of further tightening—the Federal Reserve’s September 16, 2026 statement confirms the Committee raised its target range by 0.25 percentage points to 3.75%–4.00% that month. When rate-cut expectations recede, yields on US Treasuries hold higher. Gold, which earns no yield, becomes relatively less attractive when safe-haven assets offer a real return. The dollar also tends to hold firm alongside rate expectations, which makes gold more expensive for non-US buyers and can further reduce demand.
The relationship is not a rule. When geopolitical risk rises sharply, gold can rally even when rate expectations are unfavourable, because safe-haven demand overwhelms the rate signal. In the current week, oil-price-driven inflation concerns have been the dominant force. Whether that continues depends on how the Fed signals its intentions at the October 27–28 meeting and on whether oil prices sustain their current level. For readers comparing the benchmark price to what jewellers actually charge, the gap is explained in a separate IBJA benchmark versus retail jewellery price breakdown.
Does higher oil always push gold down? No. When oil rises because of a geopolitical crisis rather than demand-side growth, gold and oil can move higher together as safe-haven buying offsets the rate-cut pushback. The direction depends on which force dominates in the specific period.
Gold’s performance in the near term depends on the Federal Reserve’s statements at the October 27–28 meeting, oil’s trajectory and the evolution of geopolitical risk in the Middle East. Check current spot price data from a live market source—Kitco, Reuters or Bloomberg—before acting on any investment decision. This article is general financial information and not investment advice.