Space Weather Alert: X-Class Solar Flares & G3 Storm Watch
Solar activity from NASA Solar Dynamics Observatory

Solar Activity Dashboard: X-Class Flares Trigger G3 Storm Watch

Tracking the powerful solar eruptions of November 2025 and their potential impacts on Earth

Last updated: November 6, 2025, 10:00 UTC

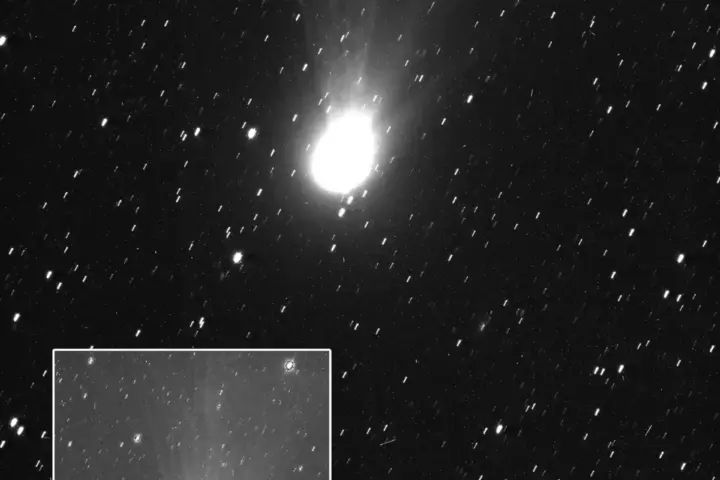
Two powerful X-class solar flares erupted on November 4, 2025 — an X1.8 from active region 4274 and an X1.1 from a region just beyond the east limb. Both flares produced coronal mass ejections (CMEs) largely directed away from Earth. Active Region 4274 continues to develop, displaying a complex beta-gamma-delta magnetic field configuration associated with high flare potential. According to NOAA’s Space Weather Prediction Center, another strong M7.4 flare was observed at 11:19 UTC on November 5, further confirming this region’s ongoing activity.

The flares follow a pattern of increasing solar activity as Solar Cycle 25 approaches its peak, with these recent X-class events occurring exactly 22 years after the historic November 4, 2003 solar flare — one of the most powerful ever recorded, estimated at X28 or possibly as high as X40.

X6.3 solar flare seen by ESA's PROBA-2/SWAP EUV imager on 22 February 2024, bright active region near the Sun's northeast limb
X6.3 solar flare captured by ESA’s PROBA-2/SWAP (22 Feb 2024), marked near the northeast limb; events of this scale often intensify space-weather alerts, setting up cause-and-effect ripples for satellite operations, radio links, and grid resilience—how quickly can operators pivot when conditions escalate? (Photo source: ESA / PROBA-2 SWAP — ESA Standard Licence).
⚠️

G3 (Strong) Geomagnetic Storm Watch: November 6-7

NOAA/SWPC has issued a G3 (Strong) Geomagnetic Storm Watch for November 6-7 UTC. G3 conditions were reached at 05:27 UTC on November 6. Enhanced aurora visibility and possible technological impacts are expected.

Latest Major Solar Flare
i Solar flares are classified as A, B, C, M, or X, with X being the strongest. The number after indicates intensity within the class.
X1.8
November 4, 2025 – Region 4274
Source: NOAA SWPC
Flare Probability (Next 24h)
i Forecasted probability for the next 24 hours based on current solar conditions and active regions.
70%
Chance of M-class flares through Nov 8
Source: SWPC 3-Day Forecast (Nov 6)
Geomagnetic Storm Level
i G-scale measures the intensity of geomagnetic storms, from G1 (Minor) to G5 (Extreme). G3 can cause aurora at mid-latitudes and satellite navigation problems.
G3
Strong – in effect as of Nov 6
Source: NOAA SWPC Alerts
X-Class Flare Probability
i Chance of experiencing an X-class flare (the strongest classification) in the next 24 hours.
25%
Increased risk from AR4274
Source: SWPC 3-Day Forecast (Nov 6)

🔮 Space Weather Forecast

NOAA’s Space Weather Prediction Center has issued a G3 (Strong) Geomagnetic Storm Watch for November 6-7 as Earth experiences the combined effects of recent solar activity. G3 conditions were reached at 05:27 UTC on November 6. The ongoing activity is caused by a glancing blow from the recent CMEs combined with a high-speed stream from a coronal hole. Region 4274’s continued growth and complex magnetic configuration suggests more significant activity is possible in the days ahead.

Nov 6
⚡⚡⚡
G3 Storm
Strong
Nov 7
⚡⚡
G1-G3
Minor to Strong
Nov 8
G1
Subsiding
← Scroll horizontally to see more →

📊Recent Solar Activity

These charts show the trend of solar activity in early November 2025, including the dramatic increase in flare intensity on November 4th with the X-class events, and the corresponding rise in sunspot counts that typically precedes major solar activity. Understanding these patterns helps scientists predict future space weather events and their potential impacts on Earth.
Data source: NOAA SWPC event reports
Data source: SILSO Royal Observatory of Belgium

🗺️Aurora Visibility Forecast

With the ongoing G3 geomagnetic storm, aurora may be visible much farther from the poles than usual. This map shows estimated visibility zones based on current conditions. The G3 storm could make auroras visible across northern US states, Canada, northern Europe, and high-latitude Asia, weather permitting. The colored zones indicate probability of seeing auroras, with green being highest and red lowest.
G3 storm conditions can bring aurora as far south as Illinois and Oregon in the US.

Timeline of Recent Events

Solar activity has increased significantly in the first week of November 2025, with multiple strong flares including two X-class events on November 4th. This timeline shows the progression of major solar events leading up to the current G3 storm conditions. Tracking these events helps us understand the development of space weather patterns and their potential impacts.
November 6, 2025 – 05:27 UTC
G3 Storm Conditions Reached
SWPC confirms G3 (Strong) geomagnetic storm conditions as CME effects combine with coronal hole stream.
November 5, 2025 – 11:19 UTC
M7.4 Solar Flare
Another strong flare from Region 4274 confirms continued activity potential. Partial-halo CME observed.
November 4, 2025 – 22:01 UTC
X1.1 Solar Flare
Second X-class flare erupted from region beyond the east limb, producing Type IV radio sweep and non-Earth-directed CME.
November 4, 2025 – 17:34 UTC
X1.8 Solar Flare
Major flare from Region 4274 produced Type IV radio emissions, 160 sfu Tenflare, and partial halo CME first visible at 17:36 UTC.
November 3, 2025 – 09:25 UTC
M5.0 Solar Flare
Moderate flare from newly visible AR4274 triggered R2 (Moderate) radio blackout over southern Africa.
NOAA SWPC notice announcing an R3 radio-blackout event on November 4, 2025, from AR4274, with CME evaluation in progress
NOAA’s SWPC notes an R3 (strong) radio blackout on November 4, 2025, associated with activity from Region AR4274, with CME assessment ongoing; short-notice shifts like these often trigger fresh debates on grid readiness, satellite drag, and aviation comms resilience—are operators prepared for rapid space-weather swings? (Photo source: NOAA/NWS Space Weather Prediction Center — U.S. Government public domain, no license number).

⚠️Potential Impacts of G3 Storm

G3 (Strong) geomagnetic storms can affect various technologies and systems on Earth. Here are the key impacts to be aware of during the current storm conditions. Understanding these potential effects helps individuals, businesses, and governments prepare and respond appropriately to space weather events.

📡Communications

High-frequency (HF) radio may experience intermittent blackouts. Degradation likely on high-latitude HF radio paths. GPS/GNSS navigation systems may experience intermittent issues with accuracy for several hours. Satellite communications could experience brief disruptions.

🛰️Satellites

Surface charging on satellite components possible. Corrections may be needed for orientation problems. Increased drag on low-Earth orbit satellites, potentially affecting orbital trajectories and requiring adjustments. Satellite operators may need to take protective measures.

Power Grid

Voltage corrections may be required in power systems. Protective measures may trigger false alarms on some grid protection devices. Long transmission lines at higher latitudes are most susceptible. Power companies may implement grid stabilization procedures.
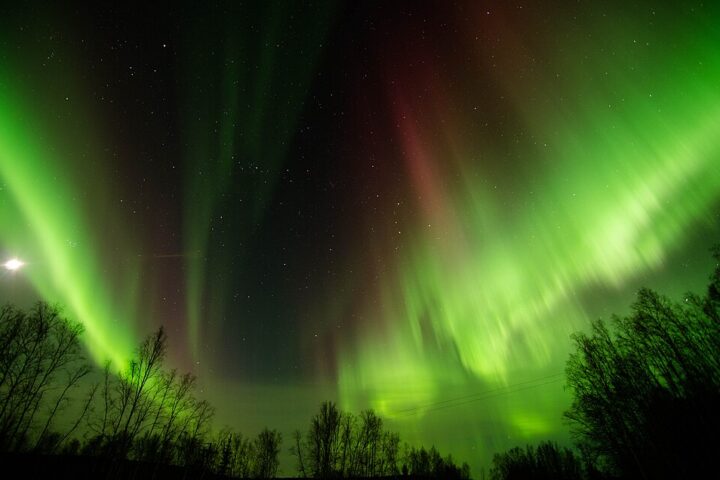
🌈Aurora

Aurora likely visible as far south as Pennsylvania, Iowa, and Oregon in the US; throughout much of Canada; northern Europe including UK and Germany; and northern Asia. Clear, dark skies away from light pollution offer best viewing conditions. Photography enthusiasts should prepare for potential displays.

ESA infographic showing how solar flares, CMEs, and energetic particles impact spacecraft, aviation, communications, and power systems on Earth
ESA infographic visualizes space-weather effects from the Sun to Earth—radiation, HF radio disturbance, navigation errors, geomagnetically induced currents—underscoring why forecast upgrades, aviation procedures, and grid hardening often move in parallel as solar activity ramps up. (Photo source: ESA/Science Office — CC BY-SA 3.0 IGO or ESA Standard Licence).

Solar Flare Classification System

Solar flares are classified according to their X-ray brightness. Each category represents a 10-fold increase in energy output over the previous class. The current X1.8 flare is nearly 10,000 times more powerful than a typical A-class flare. Understanding this classification system helps contextualize the intensity of solar events and their potential impacts.

Class X-ray Flux (W/m²) Frequency Typical Effects
X ≥ 10-4 Rare (several per month at solar maximum) Major radiation storms, widespread radio blackouts, potential satellite damage
M 10-5 to 10-4 Moderate (several per week at solar maximum) Brief radio blackouts affecting polar regions, minor radiation storms
C 10-6 to 10-5 Common (daily at solar maximum) Few noticeable effects on Earth
B 10-7 to 10-6 Very common (constant background) No effect on Earth
A ≤ 10-7 Constant background radiation No effect on Earth

Solar activity has significantly increased in early November 2025, with two X-class flares on November 4th and continued strong activity from Region 4274, which maintains a complex beta-gamma-delta magnetic configuration. A G3 (Strong) Geomagnetic Storm Watch is in effect for November 6-7, with conditions reaching G3 level at 05:27 UTC on November 6.

Enhanced aurora viewing opportunities are likely at middle latitudes, while various technological systems may experience temporary disruptions. NOAA’s Space Weather Prediction Center continues to monitor these developments, with an updated forecast showing a 70% chance of M-class flares and a 25% chance of additional X-class flares through November 8.

This dashboard will be updated as conditions evolve. For real-time alerts, consult the NOAA Space Weather Prediction Center or your local space weather information service.

Karmactive Whatsapp group - https://www.whatsapp.com/channel/0029Vb2BWGn77qVMKpqBxg3D

Leave a Reply

Your email address will not be published.

Previous Story

How Lifestyle and Medication Work Together in ED Care

Pope Field air traffic control tower photographed from ground level; U.S. Air Force image by Tech. Sgt. Michael Holzworth, Public Domain.
Next Story

FAA Cuts 10% Flight Capacity at 40 Major Airports: “Unprecedented” Shutdown Move Impacts Thanksgiving Travel

Latest from Science

Don't Miss

Hubble Space Telescope image of interstellar comet 3I/ATLAS showing a bright blue-white nucleus surrounded by a diffuse teardrop-shaped coma against a dark background with streaked stars appearing as short blue lines due to the telescope tracking the fast-moving comet.

3I/ATLAS: JWST Shows CO₂/H₂O 7.6:1 And Rapid r⁻7.5 Brightening Near Perihelion

Interstellar Visitor 3I/ATLAS (C/2025 N1): Facts, Path &