")
Renewables Beat Coal in Global Power — For the First Time in Over 100 Years
For the first time in over a century, clean electricity sources generated more power globally than coal. In 2025, renewables reached a 33.8% share of global electricity — overtaking coal at 33.0% — according to Ember’s Global Electricity Review 2026, which analyzed data from 215 countries. The last time renewables held a larger share of electricity generation than coal was around 1919, when hydroelectric power dominated the still-small electric grid. This milestone landed on Earth Day 2026, themed “Our Power, Our Planet.”
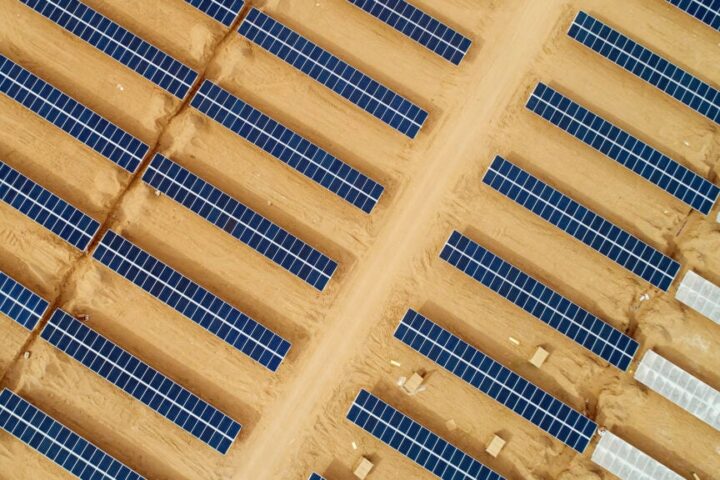
Solar drove the crossing. In 2025, solar generation grew by a record 636 terawatt-hours (TWh) — a 30% year-on-year increase — and met 75% of all new global electricity demand growth, according to Ember. Together, solar and wind met 99% of new demand. Fossil fuel generation fell 0.2%, the first time it fell because of a structural shift toward clean power rather than a recession or pandemic, per Ember’s analysis.
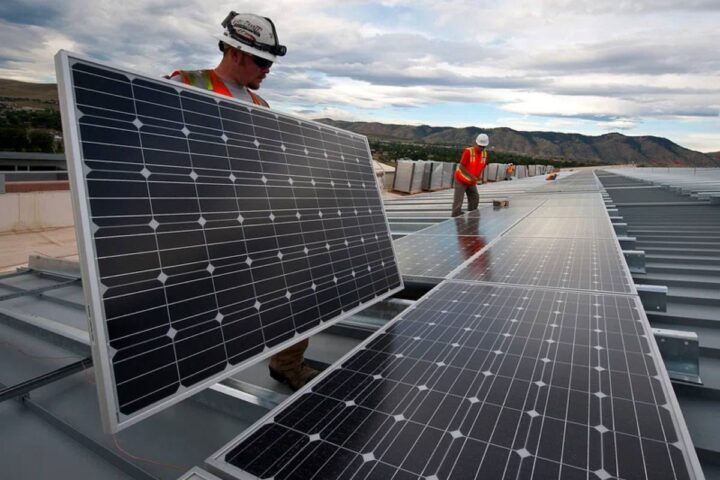
Solar’s Record-Breaking Year
No single energy source has added more electricity to the global grid in a single year than solar did in 2025. The 636 TWh increase was the largest annual generation gain ever recorded for any electricity source — outside coal’s post-pandemic rebound in 2021 — according to both the Ember Global Electricity Review 2026 and the IEA’s Global Energy Review 2026. Solar now accounts for approximately 8.7% of global electricity, up from around 3% in 2020.
IEA Executive Director Fatih Birol noted: “Electricity consumption is growing much faster than overall energy demand — and one energy source [solar PV] is growing much faster than any other. Solar PV accounted for over a quarter of all of the world’s energy demand growth — more than any other source, for the first time.” The IEA’s accompanying news release confirmed solar accounted for approximately 75% of renewable capacity additions globally in 2025.
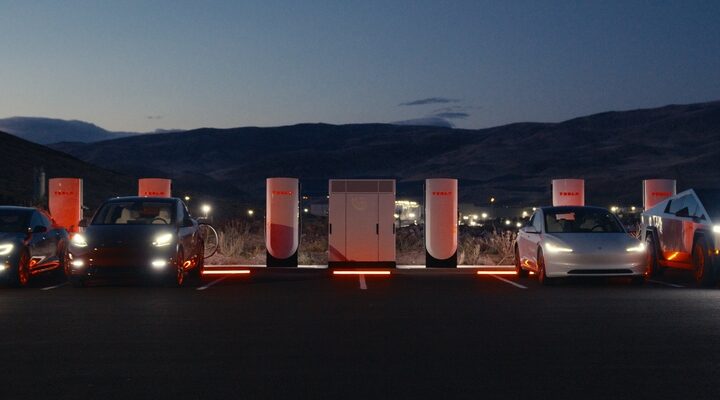
Battery storage — long cited as the missing link for grid reliability — is scaling rapidly. According to Ember’s analysis, deployment grew 46% to an estimated 250 GWh globally in 2025. Stationary storage battery pack costs fell 45% in 2025, following a 20% drop in 2024, according to BloombergNEF’s Levelized Cost of Electricity 2026 report. The IEA reported battery storage capacity additions reached approximately 110 GW — exceeding the largest-ever annual capacity additions from natural gas power plants. In the United States alone, SEIA recorded 57.6 GWh of new battery storage installed in 2025, a 52% rise over 2024.
Global Electricity Mix: 2020 vs 2025 — What Changed
2020 figures approximate; 2025 figures from Ember GER 2026 and IEA Global Energy Review 2026. Percentages rounded.
Country by Country
215 countries analyzed. Renewables overtook coal in every major region except Asia, where coal still accounts for 52% of electricity generation versus renewables at 32%. Asia accounts for 82% of global coal-fired electricity. Both China and India saw fossil generation fall in 2025 — the first time both declined in the same year this century.
China contributed more than half of the entire global solar generation increase in 2025. Its total renewable capacity reached approximately 2,159 GW by mid-2025 — about 60% of its total power generation capacity. China’s emissions trend reflects this shift, and the country exceeded its 2030 wind and solar capacity target years early. Coal still accounts for around 55% of China’s electricity generation overall, but the direction of change is now measurable.
India installed more new solar capacity than the United States in 2025 for the first time. According to the Press Information Bureau of India, India’s total installed capacity reached 509.64 GW as of November 2025, with 262.74 GW (51.5%) from non-fossil sources, meeting its COP26 commitment of 50% non-fossil installed capacity five years ahead of schedule. On July 29, 2025, renewables met 51.5% of India’s electricity demand in a single day. Data from India’s Ministry of New and Renewable Energy documents the full capacity breakdown.
According to Eurostat, 47.3% of EU electricity came from renewables in 2025, with solar as the fastest-growing source. Denmark generated 92.4%, Austria 83.1%, and Portugal 82.9% of their electricity from renewables. The IEA separately confirmed solar PV and wind in the EU passed fossil fuels for the first time in 2025. See the UK’s 2025 renewable record for parallel developments.
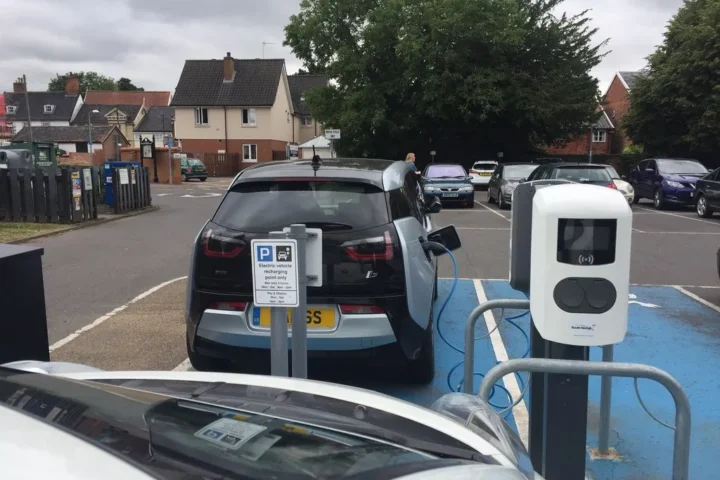
The US added 85 TWh of solar generation in 2025, though India surpassed it in new solar capacity additions for the first time. Battery storage hit a national record of 57.6 GWh installed. Texas overtook California as the largest US utility-scale solar market. Separately, battery storage projects are reshaping regional grids.
What the Numbers Mean for Daily Life
The shift in generation percentages on a report connects directly to conditions in homes, hospitals, and lungs. The World Health Organization estimates outdoor air pollution — a significant portion of which comes from fossil fuel combustion — kills approximately 4.2 million people every year. Coal-fired power plants are among the largest stationary sources of fine particulate matter (PM2.5) and nitrogen oxides. Research cited by the National Institutes of Health found PM2.5-related deaths linked to coal plants in the United States fell from 25% of all PM2.5-associated deaths (2000–2008) to 7% (2013–2016), tracking the retirement of coal capacity over that period.
On employment: IRENA and the ILO’s 2025 renewable energy jobs review counted at least 16.6 million people employed in renewable energy globally, with solar PV accounting for approximately 4.9 million of those jobs. China holds the largest national share with 7.4 million jobs (about 46% of the global total). Brazil, the EU, and India each exceeded 1 million. The transition’s impact on coal employment is uneven: coal supply jobs in advanced economies fell roughly 20% from 2019 to 2024, while India, China, and Indonesia maintained higher coal employment as domestic demand remained elevated.
The Gap That Still Exists
The milestone does not reach everywhere. More than 666 million people globally still have no electricity access, according to World Bank data. Sub-Saharan Africa includes seven countries where electrification rates are below 20%: Burkina Faso, Burundi, Chad, the Democratic Republic of Congo, Malawi, Niger, and South Sudan. Approximately 90% of clean energy investment over the past five years flowed to advanced economies and China — even though 80% of future energy demand growth will come from emerging nations.
How We Got Here: A Century of Power
A Century Ago, and What Happened Between
Before the Industrial Revolution, energy came almost entirely from wood, water, and wind. The first commercial hydroelectric plant opened in 1882. At that point, water still powered more electricity than coal. Around 1919, as electrification expanded and steam-powered coal plants multiplied, coal overtook renewables in the global electricity mix and held that position for approximately 106 years. It powered the factories, railways, and cities of the 20th century. The crossover confirmed by Ember’s 2026 data closes that arc — though coal remains dominant in Asia and significant in many developing economies.
Ember’s Nicolas Fulghum, Senior Data Analyst and lead author of the report, described how the underlying dynamic has shifted: “Clean power deployment is now at such a high level that it can structurally meet the increase in demand. In the next few years, we expect it to meet all the growth in electricity demand and start to push for a decline in fossil generation.” Fulghum also noted that “the rapid growth of solar and wind energy makes this milestone most likely permanent.”
What the Report Covered
Ember’s Global Electricity Review 2026 covered 215 countries, drawing on 2025 full-year data for 91 countries representing 93% of global electricity demand. The report documented coal falling below a third of global generation for the first time in the modern grid era. It recorded solar’s 636 TWh single-year growth as the largest generation increase ever from any source outside coal’s post-pandemic rebound in 2021. It noted that both China and India saw fossil fuel generation fall in the same year for the first time this century. Battery storage deployment and cost data were included in the analysis.
India’s crossing of 500 GW total installed capacity — with 262.74 GW (over 51%) from non-fossil sources as of November 2025 — was separately documented by the Ministry of New and Renewable Energy. Eurostat confirmed 47.3% of EU electricity from renewables. IRENA’s April 2026 press release placed total global renewable installed capacity at 5,149 GW after 692 GW of additions in 2025. The IRENA/ILO jobs review counted 16.6 million people employed in renewables. These were the figures across the 2025 electricity data that the review brought together.