Forget the old ways of measuring ocean temperatures. The Bureau of Meteorology (BOM) has a brand new tool in its weather forecasting toolkit. Since September 2025, BOM meteorologists are using a “Relative Niño Index” to track El Niño and La Niña events – those Pacific Ocean temperature patterns that drive Australian weather patterns.
The reason? Our warming oceans were throwing off the traditional measurements.
As global warming affects tropical ocean temperatures, it becomes difficult to distinguish between general warming and actual El Niño events. The Bureau of Meteorology notes that this warming can mask La Niña events and potentially overstate El Niño signals.
For farmers, emergency services, and everyday Australians wondering what weather to expect each season, this change aims to improve monitoring and seasonal guidance by clarifying the ENSO signal, which can support better decision-making.
The Ocean Thermometer Problem
Think of how we tracked El Niño before. Meteorologists measured if the central Pacific was warmer or cooler than normal. Simple enough – until climate change started pushing all ocean temperatures upward.
This warming trend created real headaches. Some cooling La Niña events were being masked because the overall ocean was warmer. Meanwhile, general warming could overstate El Niño alerts when no actual El Niño pattern existed.
Climate scientists have identified the need to filter out the climate change signal to see the natural El Niño and La Niña cycles more clearly.

How the New Measurement Works
The new Relative Niño Index uses a straightforward approach: compare the central Pacific temperatures not just to historical averages, but to what’s happening across all tropical oceans right now.
The Bureau’s formula measures how much the central Pacific (Niño3.4 region) differs from its historical average, then subtracts how much the entire tropical ocean differs from its average. Technically, the relative Niño3.4 equals the Niño3.4 anomaly minus a scaled tropical-mean anomaly (a scaling factor is applied so the index preserves the ENSO signal while removing the warming bias).
This strips away the background warming signal, clarifying the ENSO-related pattern.
The key is that BOM still uses the same threshold values (±0.8°C) to define El Niño and La Niña events – but now the measurement better reflects actual ocean patterns rather than being skewed by warming trends.
What This Means for Your Weather
The relative index and model ensembles have increased the probability of La Niña for Oct–Dec 2025 — multiple agencies now assign a higher chance for La Niña in that period (BOM models, NOAA/CPC and WMO show elevated probabilities).
For eastern Australia, that typically means:
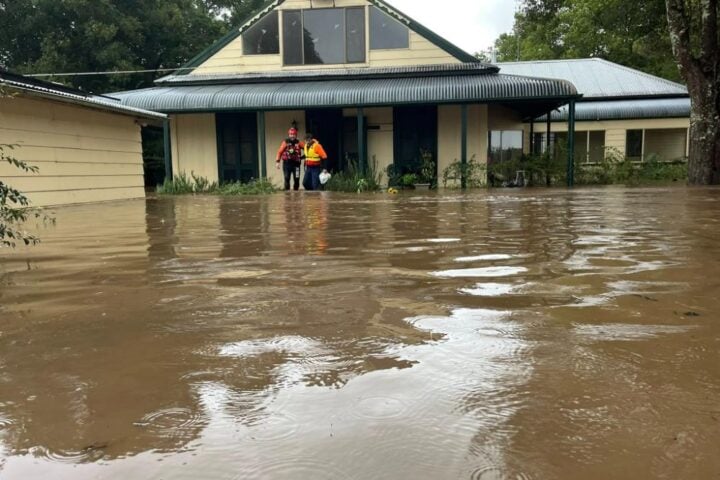
- More rainfall across northern and eastern regions
- Potential for suppressed daytime maximum temperatures in some eastern regions because of increased cloud and rainfall
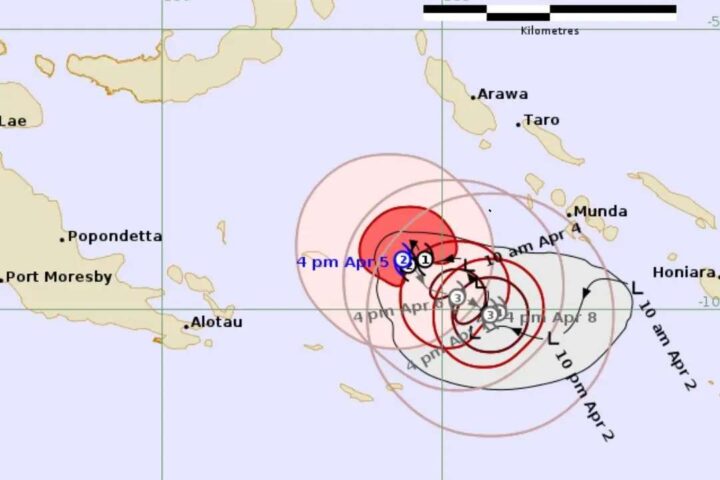
- Possibly more tropical cyclones for northern areas
The Bureau’s latest rainfall outlook shows increased chances of above-average rain for much of eastern Australia through the end of 2025 – exactly what we’d expect during La Niña.
For planners, the improved ENSO measurement is a better input to seasonal outlooks used for planting, flood preparedness and water management — but decisions remain based on the full seasonal forecasts and model ensembles.
Science-Backed Change
This isn’t Australia going solo. The relative approach has strong scientific support internationally.
A 2024 study published in the Journal of Climate by scientists from NOAA and BOM showed the new method provides more consistent identification of El Niño and La Niña events across different time periods.
The study found the relative method reduces the climate-change bias in ENSO indices while broadly preserving detection skill, though forecast performance varies by season and lead time.
The lead author of the 2024 paper, Michelle L’Heureux from NOAA, has described how the relative index reduces the warming bias in traditional Niño indices and provides a more consistent classification across time.
Weather Impacts Now
Currently, the Bureau’s outlook suggests La Niña-like conditions are developing for late 2025, bringing potentially wetter weather to eastern and northern Australia.
According to BOM’s seasonal outlook, warmer ocean temperatures surrounding Australia might enhance rainfall and storm systems in coming months.
Weather experts recommend following the comprehensive seasonal outlooks rather than focusing solely on individual index values. These complete forecasts incorporate multiple climate drivers and provide the most practical guidance.
The Bureau of Meteorology uses the new Relative Niño Index while continuing to provide its regular seasonal outlooks and forecast maps showing rainfall and temperature probabilities across Australia.
What Was Covered
The Bureau of Meteorology has shifted to a Relative Niño Index for monitoring El Niño and La Niña events as of September 2025. The method reduces sensitivity to climate change, improving consistency and relevance for monitoring. The change helps forecasters better detect ENSO patterns, with current multi-model outlooks assigning a substantially increased probability that La Niña will be present in Oct–Dec 2025.