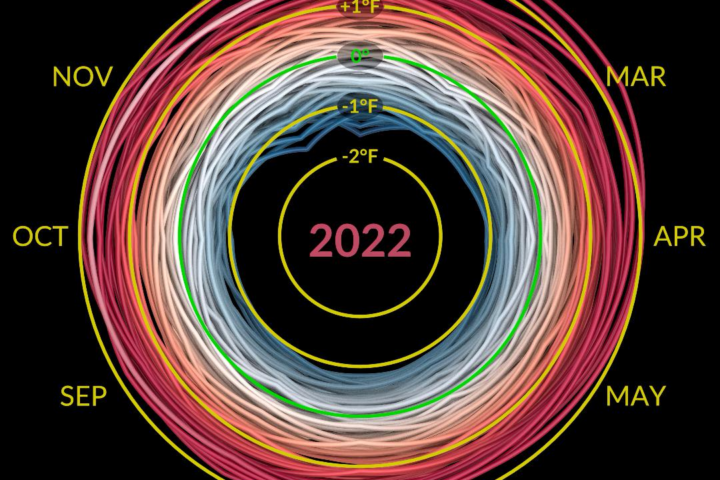
NASA Updated The Climate Spiral Visualizer Up Till 2022 In Both Degrees
NASA has updated its Climate Spiral visualizer up till 2022 and is now available in both degrees including Fahrenheit and Celsius. Climate Spiral is a visualization that shows global temperature anomalies on a monthly basis between the years 1880 to 2022. The original version of the Climate Spiral was first published on 9th May 2016, showing temperature rise till 2020. But recently NASA has updated, year 2022 to its latest version. This visualization is developed from the data available at NASA’s Goddard Institute for Space Studies (GISS). It shows temperature anomalies from the base period of 1951 to 1980. The … Continue reading NASA Updated The Climate Spiral Visualizer Up Till 2022 In Both Degrees
